Chapter 2 History
2.1 Goals of visualisation
Many tasks require the visualisation of acoustic information. Purely descriptive graphical representations may aim to invoke in the mind the sound represented. These visualisations allow passing knowledge of how something sounds from one mind to another.
“I have frequently experimented with graphic notations, and in the course of these experiments it has occurred to me that a new type of artistic experience may be opening up to us, in which musical clements could have revitalized graphic correspondences in such a way that one sensation could be triggered by another to produce synaesthesia - that is, a fusion of two art forms into a unitary experience.”
The decreasing costs of electronic data storage and transmission reduce the need for converting audio into graphical form for financial reasons. However, these trends contribute to an increased abundance and availability of acoustic data. It is usually quicker and easier to scan this large quantity of acoustic information when it is represented visually than by listening to it (Figure 2.1).
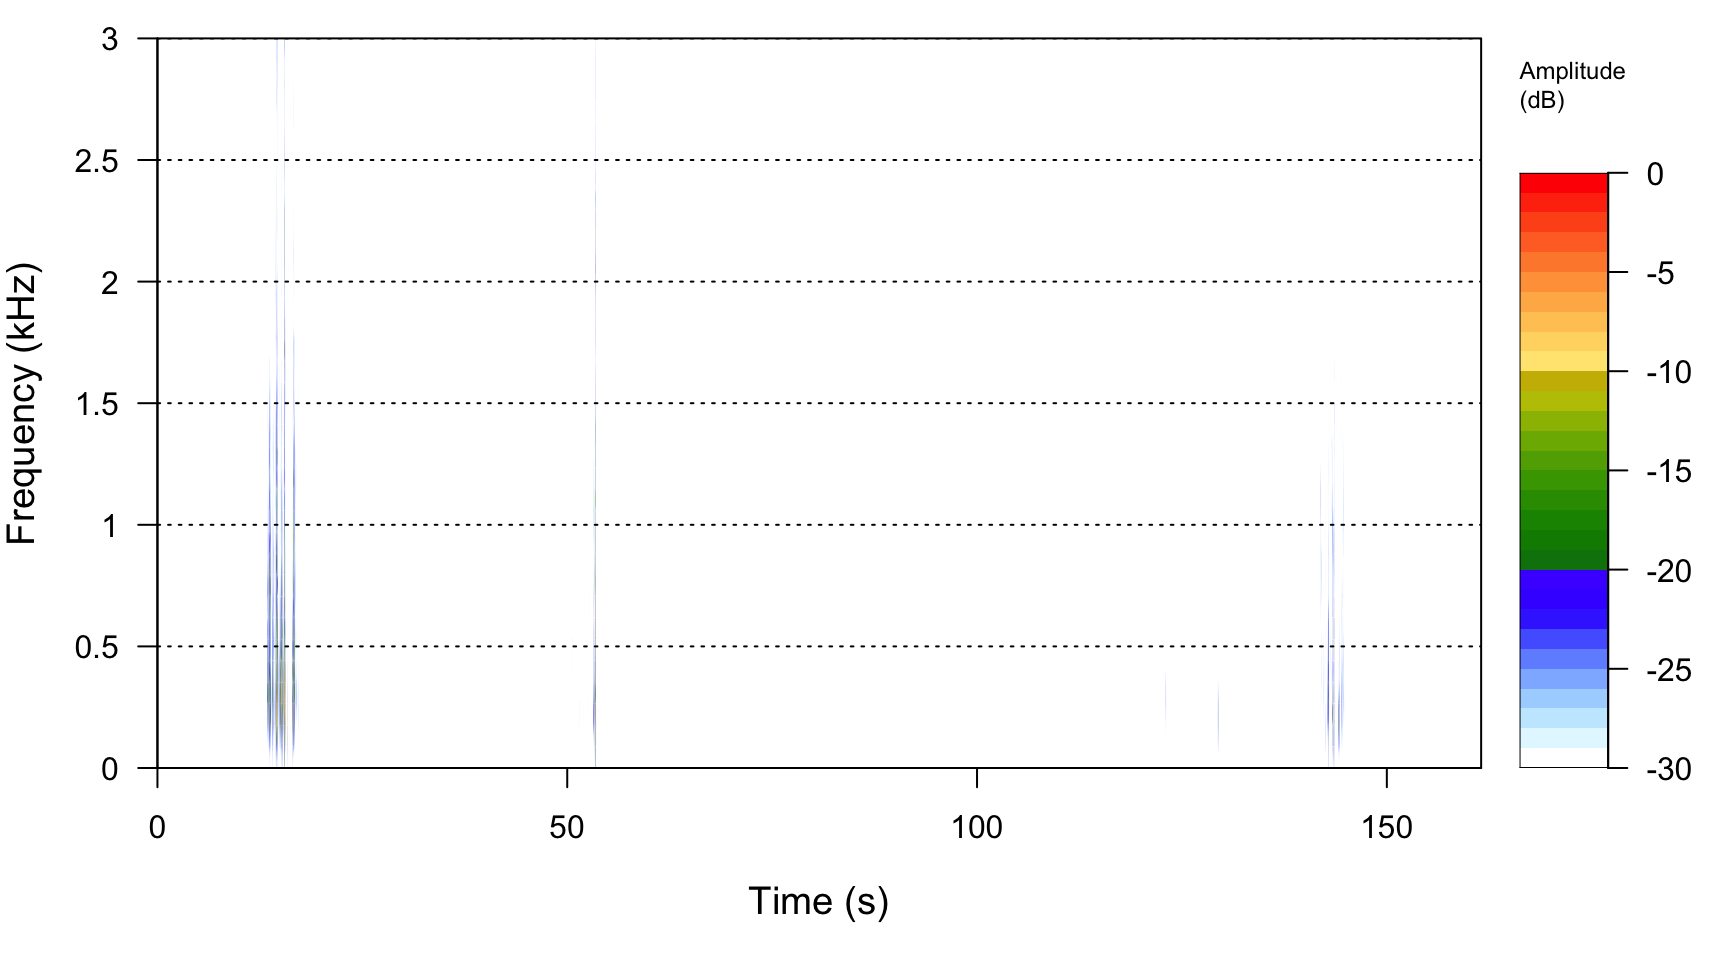
Figure 2.1: Even for a short file of three minutes duration it is quicker to identify regions of interest visually than by listening.
Notably, many current machine learning techniques used in acoustics work upon data previously converted into graphical form. Is this an optimum method, or just a consequence of the Predominance of the Visual?
2.2 Descriptive acoustics
2.2.2 Musical notation
The standard musical notations show broad similarities with a typical audio visualisation familiar to all bioacousticians and ecoacousticians - the frequency against time plot. Time proceeds in a strictly linear fashion from left to right, and frequency increases from bottom to top.