Chapter 4 Static digital images
The three fundamental quantities of sound waves are time, frequency, and amplitude. The most commonly used visualisations of sounds are consequently combinations of these properties.
The seewave package (Sueur, Aubin, and Simonis 2008) is the easiest way to produce these plots. We will use the sheep audio sample provided by seewave for the first plots.
4.1 The time domain
Time domain techniques analyse the recorded waveform directly. Conversion of a waveform to a spectrum of frequencies is a relatively costly computation. Before digital computers, frequency analysis was hard to achieve with the precision and resolution we are accustomed to today.
4.1.1 Oscillograms
Digitally sampled audio is a series of amplitude measurements sampled at a regular time interval. The most basic plot we could recreate from a sampled file would be plotting amplitude values against time, a plot known as an oscillogram.
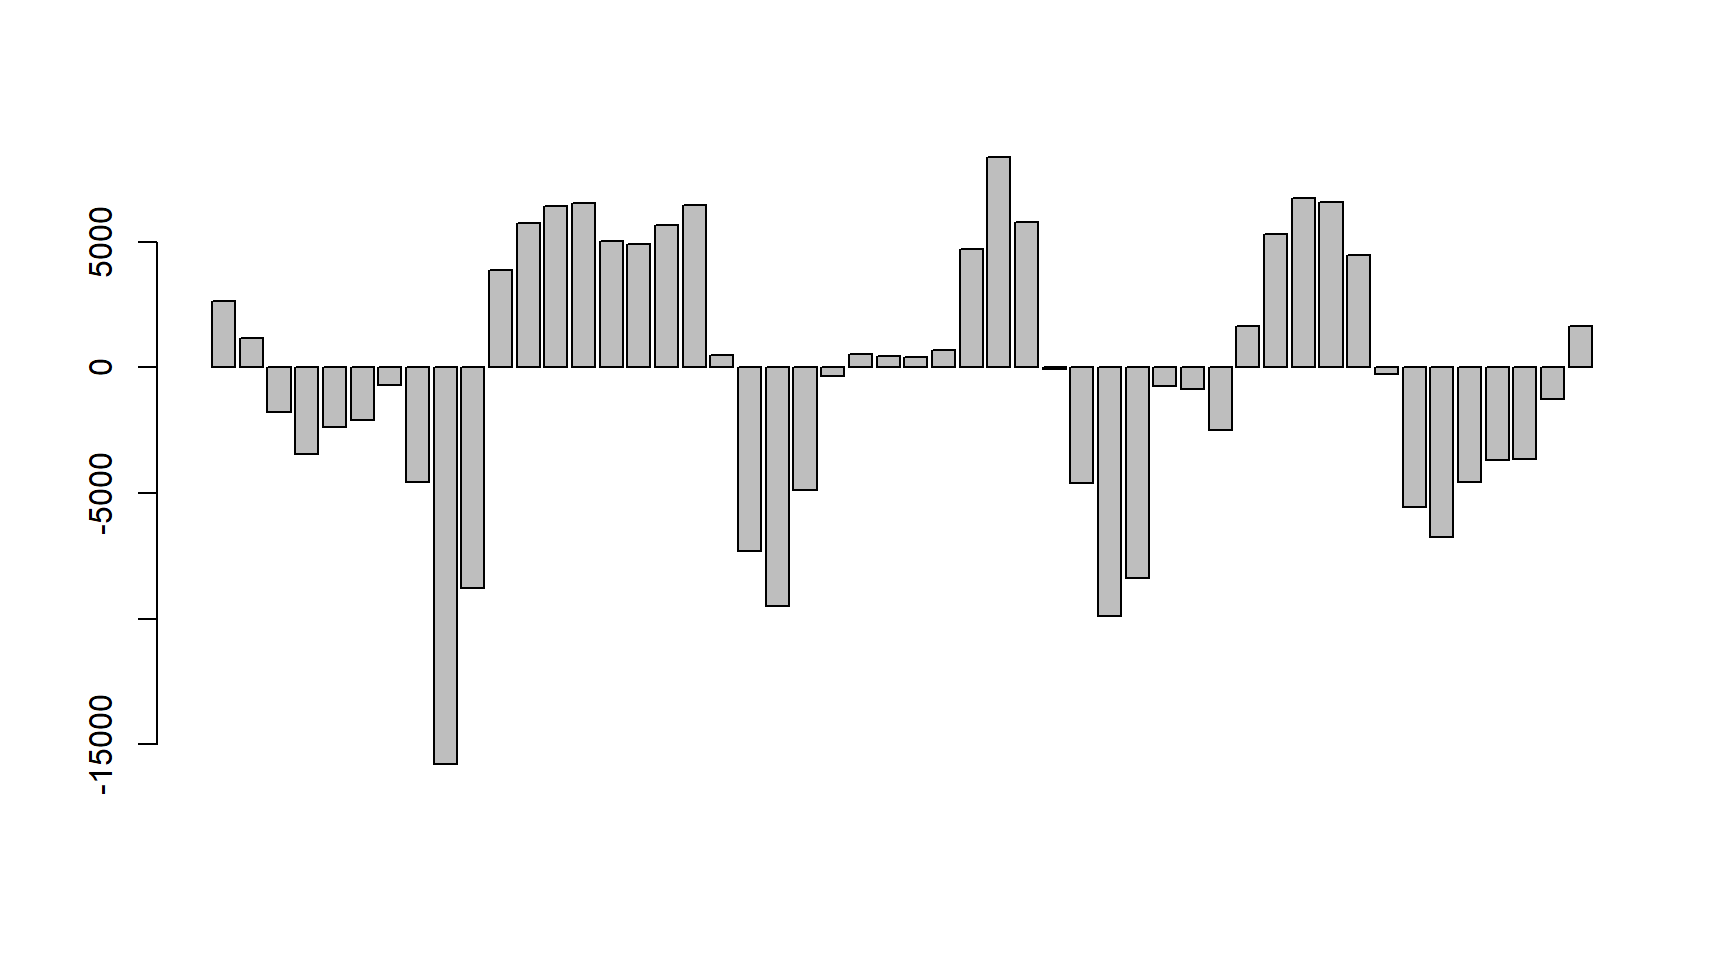
Figure 4.1: Plotting a waveform
Figure 4.1 shows 50 samples from the sheep audio file plotted using the standard R barplot()function. This representation has the advantage that the individual bars are a visual reminder that we are handling a sampled representation instead of a continuously varying waveform. It is common, however, to create a visual representation closer to that of an actual wave (Figure 4.2 shows how this is achieved using base R functions).
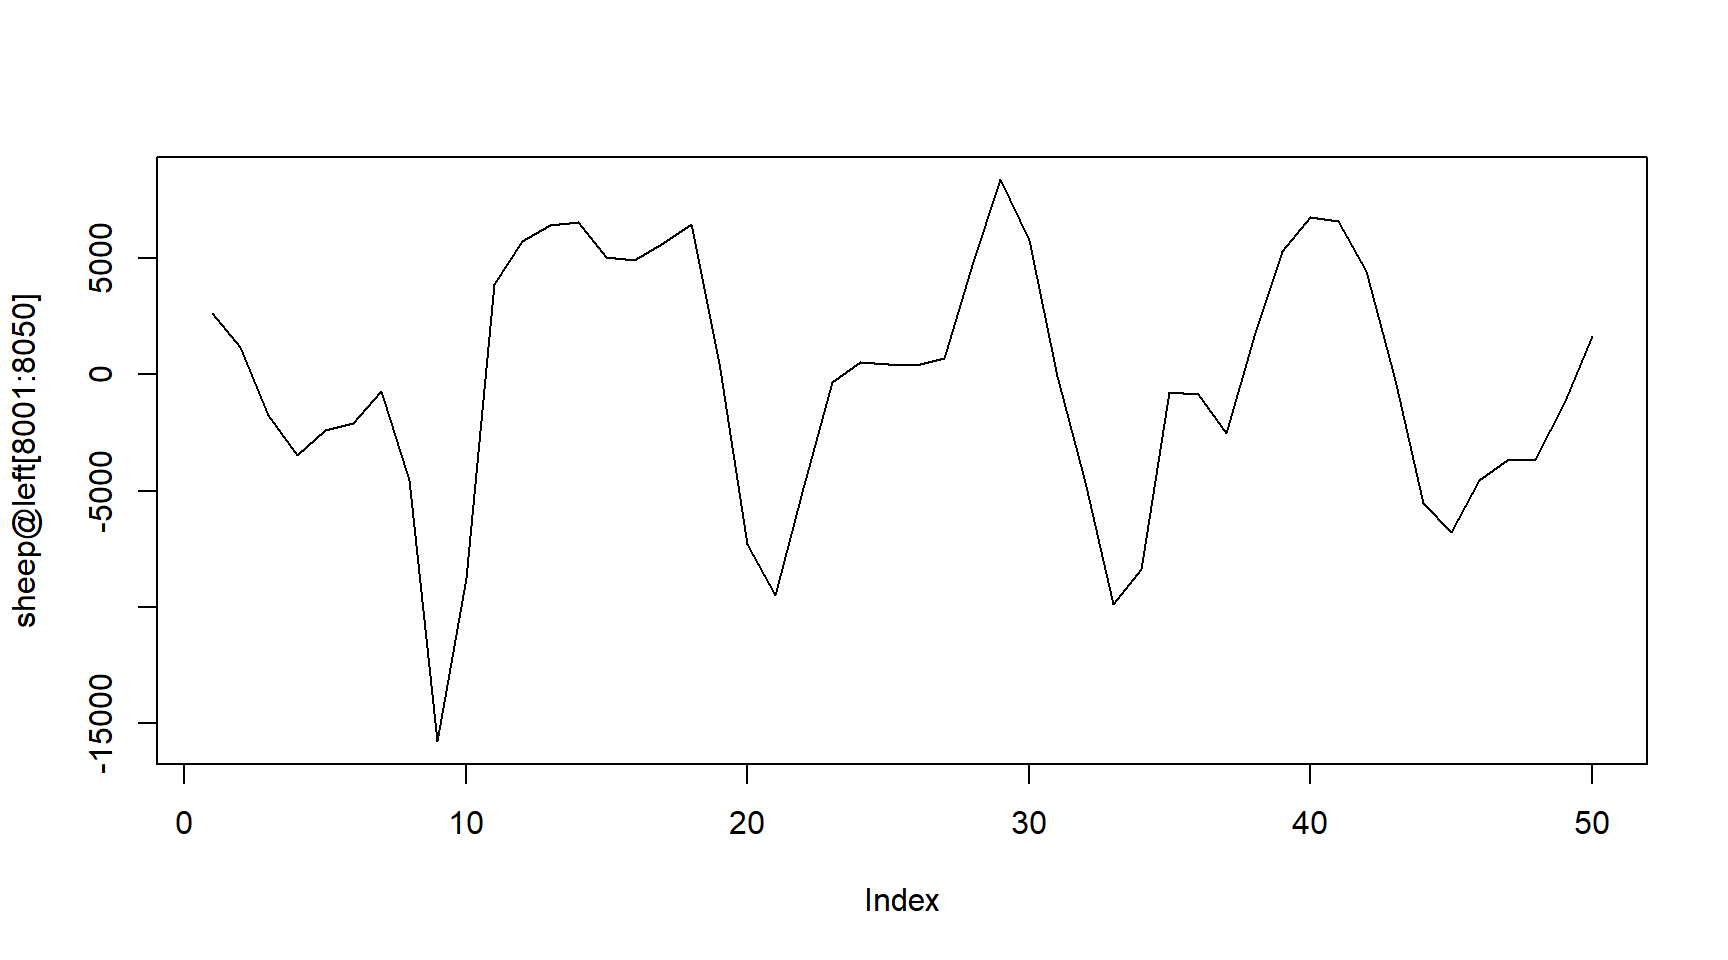
Figure 4.2: Plotting a waveform
The oscillo() function from seewave handles the labelling of axes for us and is a very convenient solution. Figure 4.3 shows the resulting plot, an oscillogram, for the entire sheep file.
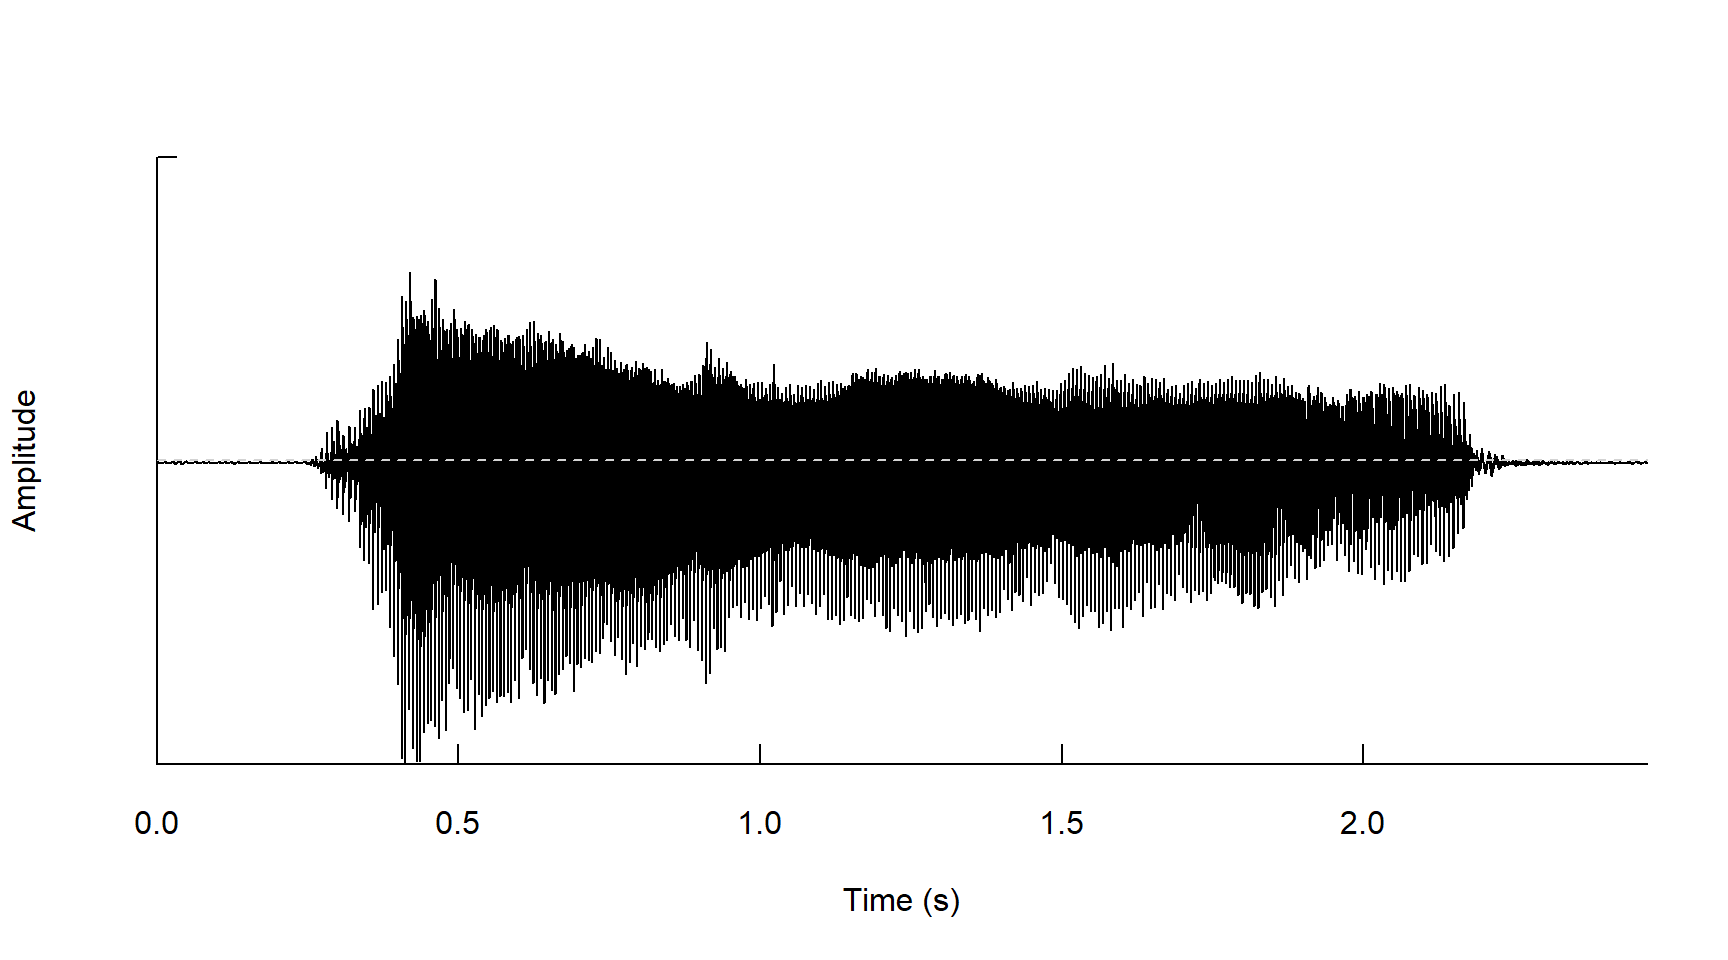
Figure 4.3: Oscillogram